Twitter

Monday, November 01, 2021

The Collaboratory Program at Columbia


A summary of my @TheHDSR paper with @IsabelleZaugg, Trish Culligan and Richard Witten on the Collaboratory Program @Columbia, a collaboration of @ColumbiaEship and @DataSciColumbia.

https://hdsr.mitpress.mit.edu/pub/j8v2h5hc/release/2 

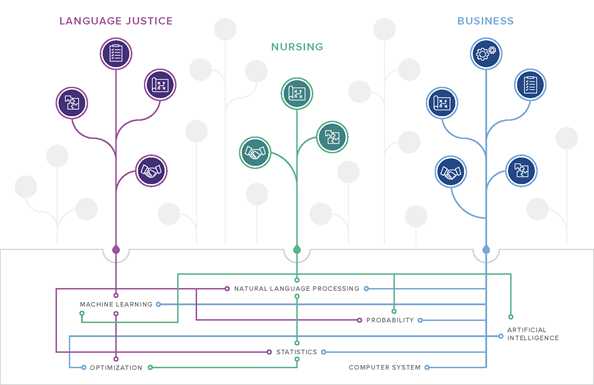
Columbia's Collaboratory program is to "Preparing Tomorrow’s Leaders for a Data-Rich World". It offers a meta-model for a data science education accelerator program that allows HE institutions to respond to their own disciplinary heterogeneity. (entrepreneurship.columbia.edu/collaboratory/)

One way to think about it is that the Collaboratory crowd-sources innovative new course designs by providing seed funding to support transdisciplinary collaboration between data scientists and domain experts, called “Collaboratory Fellows.”

The Collaboratory jumpstarts data-driven pedagogy that otherwise would take years to develop. Here is a video where a few Collaboratory program's leaders and fellows discuss the impacts of the program.

Collaboratory Program in numbers
Over the past 5 yrs,
67 Collaboratory Fellows
21 Collaboratory projects
Span 14 schools
14 institutes and centers,
26 departments
36 new courses
served the learning needs
of more than 4,000 students.

In this @TheHDSR article, we outlined different levels of data science competency and the Collaboratory's curriculum development life cycle. More importantly, we reflected on value creation through the Collaboratory and challenges that remain. The Collaboratory can be thought of as an aspen grove that stems from a unifying idea and funding source and shares the Collaboratory Fellows cohort structure of mutual support and collective resources. It consistently drives the creation of new courses that serve students throughout the many domains of the university, just like an aspen grove sending out new shoots that grow into trees, quickly covering large landmasses with a beautiful canopy.

Wednesday, July 11, 2018

Forget P-values? or just let it be what it is

P-value has always been controversial. It is required for certain publications, banned from some journals, hated by many, yet quoted widely. Not all p-values are loved equally. Because of a "rule" popularized some 90 years ago, small values below 0.05 have been the crowd's favorite.

When teaching hypothesis testing, we explain that the entire spectrum of p-value serves a single purpose: quantifying the "agreement" between an observed set of data and a statement (or claim) known as the null hypothesis.

Why are we "obsessed" with the small values then? Why can't we talk about any specific p-value the same way we talk about today's temperature? i.e., as a measure of something.

First of all, the scale of the p-value is hard to talk about. This is different from temperature. The difference between 0.21 and 0.20 is not the same as 0.02 and 0.01.

It almost feels like we should use the reciprocal of a p-value to discuss the likeliness of the corresponding observed "data" (represented by a summary/test statistic), assuming the null hypothesis is true.
If the null hypothesis is true, it takes, on average, 100 independent tests to observe a p-value below 0.01. The occurrence of a p-value under 0.02 is twice as likely, taking only about 50 tests to observe. Therefore 0.01 is twice as unlikely as 0.02. Using a similar calculation, 0.21 and 0.20 are almost identical in terms of likeliness under the null.
In Introductory Statistics, we teach that a test of significance has four steps:
  1. stating the hypotheses and a desired level of significance;
  2. computing the test statistics;
  3. finding the p-value;
  4. concluding given the p-value. 
It is step 4 that requires us to draw a line somewhere on the spectrum of p-value between 0 and 1. That line is known as the level of significance.

I never enjoyed explaining how one would choose a level of significance. Many of my students felt confused. Technically speaking, if a student derived a p-value of 0.28, she can claim it is significant at a significance level of 0.30. The reason why this is silly is that a chosen significance level should convey a certain sense of rare occurrence: so rare that it is deemed contradictory with the null hypothesis. No one of common sense would argue a chance that is close to 1 out of 3 represents rarity.

What common sense fails to deliver is how rare is contradictory enough. A recent HBR article showed that people have a wide variation in how they perceive a concept of likelihood such as "rare".

The solution?
"Use probabilities instead of words to avoid misinterpretation." 
P-value and significance level serve precisely this purpose.

Why 1/20 needs to be a universal choice? It doesn't. Statisticians are not quite bothered by "insignificant results" as we think 0.051 is just as interesting as 0.049. We, whenever possible, always just report the actual p-value instead of stating that we reject/accept the null hypothesis at a certain level. We use p-value to quantify the strength of evidence between variables and studies.

However, sometimes we don't have a choice so we got creative.

For any particular test between a null hypothesis and an alternative, a representative (i.e., not with selection bias) sample of p-values will offer a much better picture than the current published record of a handful of p-values under 0.05 out of who-knows-how-many trials. There have been suggestions on publishing insignificant results to avoid the so-called "cherry-picking" based on p-values. Despite the apparent appeal of such a reform, I cannot imagine it is practically possible. First of all, if we can assume that most people have been following the 0.05 "rule", publishing all the insignificant results will result in a 20-fold increase in the number of published studies. Yet it probably will create a very interesting data set for data mining. What would be useful is to have a public database of p-values on repeated studies of the precisely same test (not just the null hypothesis, as the test depends on what is the alternative as well). In such a database, p-value can finally be just what it is, a measure of agreement between a data set and a claim.

Thursday, June 21, 2018

DSI Scholars Initiation Boot Camp - Project-based learning of the Data Science life cycle

"How do you give a Data Science bootcamp to a mixed cohort of undergraduate and graduate students from a wide range of disciplines?" This is a question I was facing earlier this year when I needed to design the initiation boot camp for our inaugural class of DSI Scholars.  Some of them are rising sophomores, and some of them are PhDs in English. Some of these students had years of coding experience, some of these students had taken a full curriculum in Statistics and Machine Learning, and some of them thought "we probably won't fit in a data science boot camp at all."

The DSI Scholars program is to promote data science research and create a learning community for student researchers, especially during the slow months of summer. The learning goals of the boot camp were designed to be less about specific ML tools or programming languages. Rather it was set out to be about the data science lifecycle, statistical thinking, data quality, reproducibility, interpretability of ML methods, data ethics ...


Therefore ...

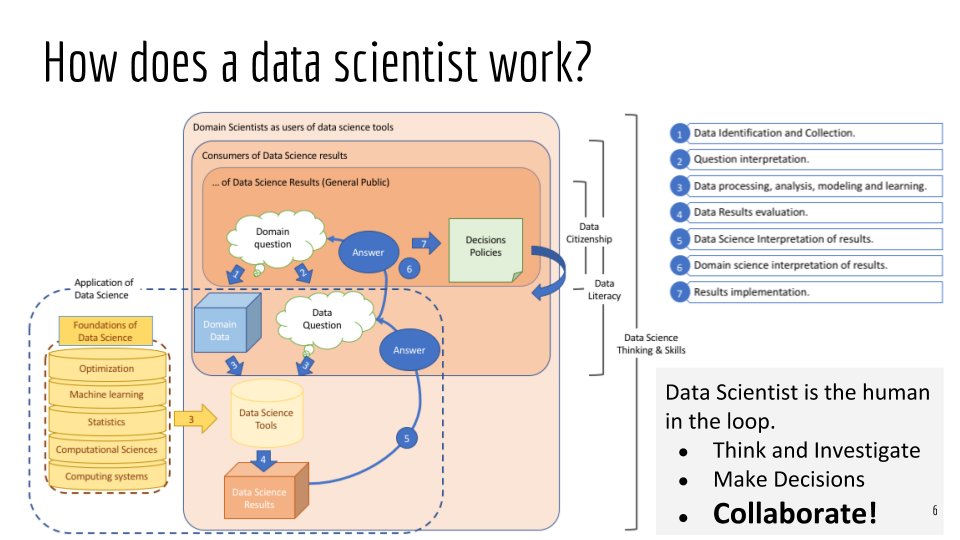
In 5 days, student teams carried out the tasks of 

  • mapping research question - understand the domain question, identify data for answering the question and interpret the domain question to a data question;
  • applying DS tools - for the data question, carry out exploratory data analysis, create data visualization and choose appropriate models and machine learning algorithms;
  • interpreting and discussing results - what do the data results suggest in the light of the original research questions. 
Here is the approximate schedule of our bootcamp.

Day 1: studied the news coverage on @ProPublica story, discussed "what is fairness?" (taking notes from @mrtz's fairmlclass.github.io), played the Ultimatum Game, watched how monkey perceives fairness and failed to balance 2 definitions of fairness. 


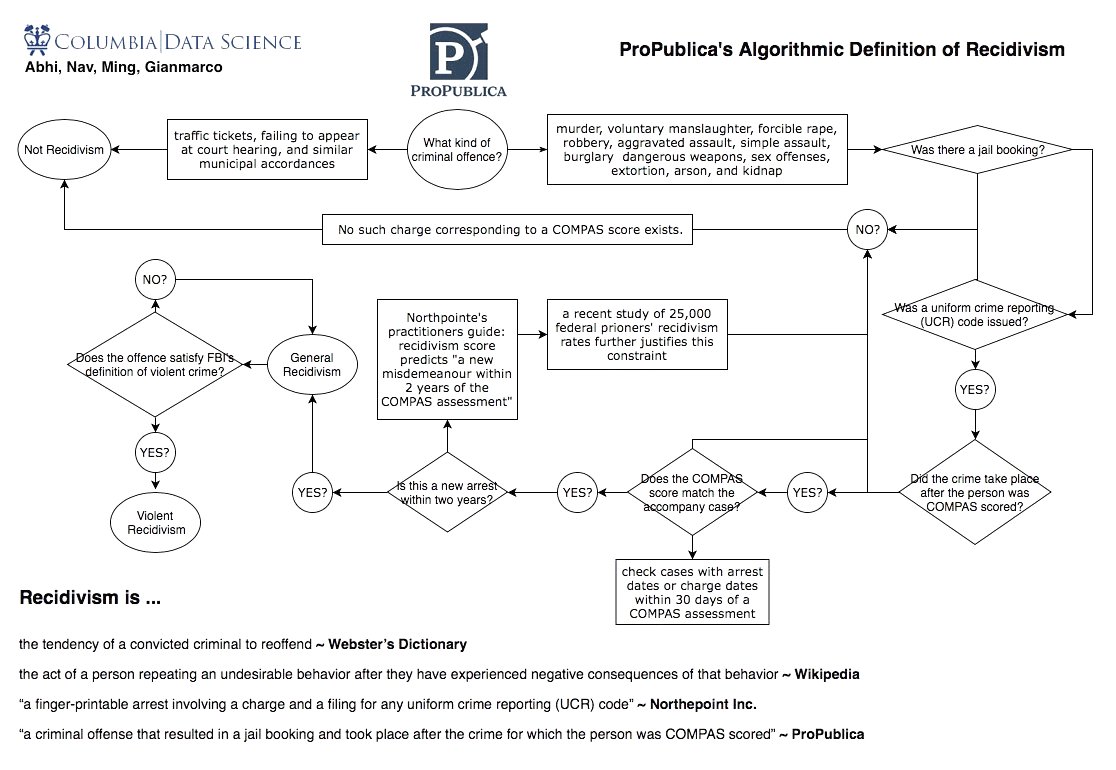
Day 2a: teams studied @ProPublica's detailed account of their analysis (propublica.org/article/how-we…). Each team presented a part of the report. One team studied in detail how "recidivism" is defined in the study and commented "whether we should even be predicting recidivism." 


Day2b-Day3a: teams were then tasked to reproduce the analysis using data and codes shared (github.com/propublica/com…) and asked to explore the data more. 

Day 3b: we studied research on interpretable ML for recidivism prediction (arxiv.org/abs/1503.07810). We focused on how new ML tools were developed, evaluated and compared with conventional approaches; and how the evidence supporting new research presented and communicated.

Day 4-5: the teams worked on one idea they'd like to try with the data and presented their final projects. We didn't find a solution but we asked many good questions. Read more about our bootcamp at datascience.columbia.edu/scholars/bootc…

Tuesday, October 10, 2017

Statistical thoughts on learning from Google search trends

Today I was invited to gave comments at the book signing presentation by Seth Stephens-Davidowitz on his book: "Everybody Lies: Big Data, New Data, and What the Internet Can Tell Us About Who We Really Are". Here are my comments, which were random statistical thoughts I had while reading this book.
    • "many economists to pay more attention to human behavior”
    • “people are not rational”
    • Reminded me of the most interesting aspect of this book: behind every google search, there is a human decision. 
  • Google search expanded our knowledge. 
    • There are two types of knowledge: the facts that you know and the facts that you know how to find them when needed. 
    • Google increased the amount of the second type of knowledge by multiple magnitude. 
    • In 2012, it is estimated that there are 3.3 billions Google searches per day, 47K a second.
    • Now: 63K from Live Internet Stats.
  • Google ranking algorithm: 
    • How does it change how we acquire knowledge and evaluate evidence? 
    • Has it been using personalization based on your location and prior search pattern? 
    • In what ways does a Google search differ from people asking friends for opinions or suggestions?
    • Google consumer confidence report 2017
      • Trust in Google remains high as 72.3% of respondents trust the accuracy of Google search results.
      • 63.7% of respondents don’t know how Google make money from search.
      • 65.3% said they would not want more relevant Google search results if it meant Google would use their search history to generate their results – something which Google is doing anyway.
  • Google Flu Trends story
    • In 2008, researchers from Google experimented predicting trends of seasonal flu based on people’s searches. 
    • They published a paper in Nature, explaining an intuitive idea that people who are coming down with the flu would search for flu-related information on Google, providing almost instant signals of overall flu prevalence. 
    • The research behind this paper was based on machine learning algorithms constructed using search data fitted against real-world flu tracking information from the Centers for Disease Control and Prevention. 
    • In 2013, Google flu trends missing at the peak of the 2013 flu season by 140 percent. 
    • In a 2014 Science paper, researchers found that 
    • Google’s GFT algorithm simply overfitted. 
    • It is sensitive to seasonal terms unrelated to the flu, like “high school basketball.” 
    • Google’s GFT algorithm also did not consider changes in search behavior over time, including influences from their own new search features.
    • It was suggested that GFT should be updated in collaboration with CDC. 
    • This is an example that there is information in “big data” but using such information to derive correct knowledge and insights require careful modeling and interdisciplinary collaboration. 
  • Natural language is hard
  • Actually science is hard.
  • Google search reveal secrets
    • Related to research conducted by my collaborator Sarah Cowan.
  • Pay attention to data collected and not collected: https://www.squawkpoint.com/2015/01/sample-bias/

Monday, September 25, 2017

Aggregated relation data (ARD), what is that?

Today, an academic friend of mine asked me about a series of papers I wrote on the topic of "how many X's do you know" questions. These papers are about a special kind of indirect "network" data that do not have detailed information on individual edges in a network. Rather, it contains counts of the edges that connects an ego towards a number of specific subpopulations.

Relational data, such as records of citations, online communication and social contacts, contain interesting information regarding the mechanisms that drive the dynamics of such interactions under different contexts. Current technology allows detailed observation and recording of these interaction, creating both opportunities and challenges. Aggregated relation data (ARD) are local summaries of these interactions, via aggregation. This has become a useful and common means of learning about hidden, hard-to-count and relatively small populations in the social network, also known as the network scale-up method.

Our papers since 2006 started with proposing better statistical models for such data. We further discussed data collection insights we came to realize during our research. We showed that via innovative statistical modeling, ARD can be used to estimate personal network sizes, the sizes and demographic profiles of hidden populations, and non-random mixing structures of the general social network. In particular, in our 2015 paper, we proposed  a model for ARD that is close to the latent space model by Hoff et al (2002) for full-network data. This would allow us to connect and possibly combine information from ARD with partially observed full network data.

Monday, November 07, 2016

Postdoc position in Applied Statistics and Bayesian Modeling available immediately

A full-time postdoctoral position is available beginning immediately in the research group of Professor Tian Zheng working on reproducible modeling of social and behaviorial data using Bayesian computing, in close cooperation with our collaborators in social sciences. 

Requirements: The work is highly interdisciplinary, and applicants must have strong statistical and computational skills. Preferred educational background is a PhD in statistics, computer science, computational social science or a related field. Expertise in statistical computing is required. Experience with R/Stan, Python, and/or data visulization is preferred but not necessary. 

Environment: The research group is at Columbia University, based in the Statistics department, in the great city of New York. There will also be the opportunity to interact with our collaborators on other research projects involving psychology, genetics, and neural science.

Appointment: The initial appointment will be for one year, and is renewable. Salaries will be set based on experience and skills.

Applicants should send email to tzheng@stat.columbia.edu providing:
• a brief description of past research experience
• a brief description of future research interests and goals
• a resume of educational and research experience, including publications
• three letters of reference


Wednesday, September 28, 2016

ASA SLDS JSM 2017 student paper competition

Call for papers
Student Paper Competition - JSM 2017
(July 29th-Aug 3rd, 2017, Baltimore, MD)
ASA Section on Statistical Learning and Data Science
Sponsored by SLDS

Key dates:
• Abstracts due December 15th, 2016
• Full papers due January 4th, 2017

The Section on Statistical Learning and Data Science (SLDS) of the American Statistical Association (ASA) is sponsoring a student paper competition for the 2017 Joint Statistical Meetings in Baltimore, MD, on July 29th-August 3rd, 2017.

The paper might be an original methodological research or a real-world application (from various fields including but not limited to marketing, pharmaceutical, genomics, bioinformatics, imaging, defense, business, public health) that uses principles and methods in statistical learning and data science.

Papers that have been accepted for publication are NOT eligible for the competition. Selected winners will present their papers in a designated topic-contributed session at the 2017 JSM in Chicago, IL organized by the award committee. In this session, they will be presented a monetary prize and an award certificate. Winning papers will be recommended for submission to Statistical Analysis and Data Mining: The ASA Data Science Journal, which is the flagship journal of the SLDS Section.

Graduate or undergraduate students who are enrolled in Fall 2016 or Winter/Spring 2017 are eligible to participate. The applicant MUST be the first author of the paper.

Abstracts (up to 1000 characters) are due 12:00 PM (noon) EST on December 15th, 2016 and shall be submitted via this Abstract submission form (https://goo.gl/forms/jkPrjVuRbeLUufGm2). ONLY students who submit their abstracts on time are eligible for submitting full papers after 12/15/2016.

Full papers and other application materials must be submitted electronically (in PDF, see instruction below) to Professor Tian Zheng (tian.zheng@columbia.edu) by 12:00 PM (noon) EST on Wednesday, January 4th, 2017. ONLY students who submit their abstracts by 12/15/2016 are eligible for submitting full papers.

All full paper email entries must include the following:
  1. An email message contains:
    • List of authors and contact information;
    • Abstract with no more than 1000 characters.
  2. Unblinded manuscript - double-spaced with no more than 25 pages including figures, tables, references and appendix. Please use 11pt fonts (preferably Arial or Helvetical) and 1 inch margins all around.
  3. Blinded versions of the abstract and manuscript (with no authors nor references that could easily lead to author identification).
  4. A reference letter from a faculty member familiar with the student's work which MUST include a verification of the applicant's student status and, in the case of joint authorship, should indicate the fraction of the applicant's contribution to the manuscript.
All materials must be in English.

Entries will be reviewed by the Student Paper Competition Award committee. The selection criteria used by the committee will include statistical novelty, innovation and significance of the contribution to the field of application as well as the professional quality of the manuscript.

This year’s student competition is sponsored ASA SLDS and is chaired by Professor Tian Zheng (Columbia University). Award announcements will be made in mid-January 2017. For inquiries, please contact Professor Tian Zheng (tian.zheng@columbia.edu).

Saturday, September 10, 2016

Resources for data analytics at Columbia

I got an email asking for resources (other than courses) for data analytics at Columbia. This is what I wrote in reply:

Monday, September 05, 2016

ADS alum Yuhan Sun's summer intern at UNICEF

An Spring 2016 alum from our Applied Data Science course , Yuhan Sun (MA in Statistics, Columbia University), spent the past summer as a data scientist at UNICEF. She extended a Shiny app that provides a web-based application for generating child mortality estimates. These estimates are computed from empirical data using the United Nations Inter-agency Group for Child Mortality Estimation (UN IGME) methodology. According to Ms. Lucia Hug from UNICEF,
"The UN IGME methodology applies a curve fitting method to derive trend estimates by using a Bayesian B-splines bias-reduction model to empirical of under-five and infant mortality rates. The method also extrapolates the trend estimates to a defined time point."
In this project, Yuhan applied her skills on Shiny app development learnt during our ADS course to meet the needs of this task. She said:
"Shiny provides a feasible approach for non-cs people to build a web application. It is an effective and time efficient way to build an application which uses the existing R codes for the Bayesian B-spline bias-reduction model. It also enables users to use the UN IGME methodology without being familiar with running R codes. It allows to apply the model to new empirical data and to review the new estimates graphically. It also offers the possibility to visualize the results and to adjust parameters according to the users’ needs."
Ms. Hug said: "Mortality rates among young children are a key output indicator for child health and well-being, and, more broadly, for social and economic development. It is a closely watched public health indicator because it reflects the access of children and communities to basic health interventions such as vaccination, to medical treatment of infectious diseases and to adequate nutrition."

Yuhan is also working on some cool visualizations as part of her internship.

Saturday, September 03, 2016

A happy birthday in numbers

On my birthday, I received a total of 65 "happy birthday!" messages (in either Chinese or English) via social messaging. For the first year, I got birthday wishes from LinkedIn. I thought it'd be fun to visualize using Tableau some basic information about these social messages, as a snapshot of a subset of my social network.
  • More than 3/4 of my birthday wishing social network are Chinese.
  • The biggest three groups in my current online social networks of nice people are via family, via work, and via kids, which are the three main (if not ONLY) occasions of my social interactions. 
  • My Chinese friends are active on Wechat and my non-Chinese friends are mostly on facebook.
  • Facebook and LinkedIn both post reminders about upcoming birthdays. From the trends, it seems that LinkedIn users are only active in the morning or in the evening, while Facebook users (at least those among my FB friends) are more active during the day and around meal times. 


Thursday, September 01, 2016

Applied Data Science

Another semester of data science fun is just around the corner. 
Follow us at TZStatsADS.


Wednesday, August 17, 2016

Postdoc position available immediately

Postdoctoral position in spatiotemporal data analysis

A full-time postdoctoral position is available beginning immediately in the research group of Professor Tian Zheng working on analysis of large spatiotemporal data sets, in close cooperation with our collaborators in neural imaging. 

Requirements: The work is highly interdisciplinary, and applicants must have strong statistical and computational skills. Preferred educational background is a PhD in statistics, computer science, computational neural science or a related field. Expertise in high performance computing is required. Experience with GPU computing is preferred but not necessary. 

Environment: The research group is at Columbia University, based in the Statistics department, in the great city of New York. There will also be the opportunity to work with our collaborators on other research projects involving statistical computing, genetics, and computational social science.

Appointment: The initial appointment will be for one year, and is renewable. Salaries will be set based on experience and skills.

Applicants should send email to tzheng@stat.columbia.edu providing:
• a brief description of past research experience
• a brief description of future research interests and goals
• a resume of educational and research experience, including publications
• three letters of reference

Wednesday, May 04, 2016

Call for papers--Statistical Learning for Data Science (SLDS)

Call For Papers 

(New deadline: June 12, 2016)

Special Session on

"Statistical Learning for Data Science (SLDS)"

In DSAA 2016: The 3rd IEEE International Conference on Data Science and Advanced Analytics

Montreal, Canada October 17-19, 2016

Organized by

  • Tian Zheng (Department of Statistics, Columbia University)
  • Wei Pan (Department of Biostatistics, University of Minnesota)
  • Hernando Ombao, (Department of Statistics, University of California at Irvine) 

Program Committee members

  • Genevera Allen (Department of Statistics, Rice University) 
  • Ke Deng (Center for Statistical Science, Tsinghua University)
  • Charles Doss (School of Statistics, University of Minnesota)
  • Bailey Fosdick (Department of Statistics, Colorado State University)
  • Mladen Kolar (University of Chicago, Booth School of Business)
  • Xi Luo (Department of Biostatistics and Center for Statistical Sciences, Brown University)
  • Ali Shojaie (Department of Biostatistics, University of Washington)
  • Gongjun Xu (School of Statistics, University of Minnesota)
  • Alexander Volfovsky (Department of Statistical Science, Duke University)
  • Sijian Wang (Department of Statistics, University of Wisconsin at Madison)
Statistics plays a central role in the data science approach. This special session is to engage discussion from statisticians who study methods and theory that are fundamental to data science. Paper submissions on recent advances in statistical learning and modeling for complex data are encouraged.
Topics of interests are, but not limited to,
  • Advances in theory or models associated with the analysis of massive, complex datasets;
  • Statistical modeling and data mining for data-driven solutions of real-world problems;
  • Innovative data mining algorithms or novel statistical approaches;
  • Comparison of techniques to solve a problem, along with an objective evaluation of the analyses and the solutions.
Conference content will be submitted for inclusion into IEEE Digital Library. The conference proceedings will be submitted for EI indexing through INSPEC by IEEE. Top quality papers accepted and presented at the conference will be selected for extension and publication in the special issues of some international journals, including IEEE TKDE, ACM TKDD, ACM TIIS and WWWJ.

Journal publication

Extended versions of accepted papers to this special session will be considered for a special issue of Statistical Analysis and Data Mining, the ASA data science journal.

Key dates

  • Paper Submission deadline: Sunday 12 June, 2016, 11:59 PM PDT
  • Notification of acceptance: 15 July, 2016
  • Final Camera-ready papers due: 19 August, 2016

Submission Instruction

Monday, January 18, 2016

Project-based learning (PBL)

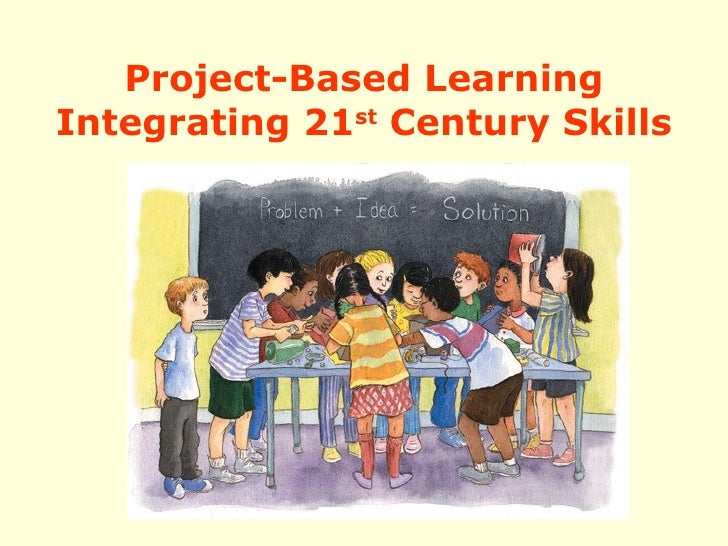
This semester I will be teaching Applied Data Science (W4249), a project-based learning (PBL) course. I came up with the idea for this course without being award of this line of discussion in education innovation. As I have been preparing for this course, I started looking for research on instructional practices using projects. I have discovered some very nice discussion on PBL. PBL has been more widely discussed in K-12 education, especially in STEM curriculums. One of the main objective of PBL is to guide students in the process of turning into self-directed life learners. This is quite appealing as one can never acquire, within their time in school, all the knowledge required to solve all the problems. 


Thursday, November 12, 2015

What can "Cinderella", the classic children's story, teach us about model selection?

Today in my linear regression class, we accidentally realized a nice example for model selection from classic children's literature, "Cinderella."

First, we need to define our selection goal: find a suitable wife (model). Second, we need to define our selection criterion. The king wanted a "suitable mother" but the prince was looking for something more. Third, given all the possible models, we need to decide how to carry out the search, or the search mechanism. How did they search for the best fit in the story? "By royal command, every eligible maiden is to attend!" In other words, we are going to evaluate all candidate models. 

At the ball, the prince spotted his best fit. But unfortunately, he didn't save his selected model. He needs to search again. This time, he simplified his criterion to a single glass slipper (which is absurd, as if it fits perfectly it won't fall off in the first place) as he now knew the best fit have this characteristic. Due to this simplification, for the second search, the prince does not have to be the selection criterion any more. They found a good surrogate, the glass slipper. After this round of thorough search, they found the prince's match. 

The story "Cinderella" is a story on all possible regression method. Selection-criterion + all possible candidate models is the most reliable way of finding the best match. Greedy search or stochastic search do not have the same guarantee. An exhaustive search is tedious, expensive (a grand dance ball in a real palace!) and time consuming. It helps when the search criterion can be replaced by a simpler surrogate (a glass slipper as opposed to a face-to-face dance) and when the model space is small ("a tiny kingdom in a faraway land").

Friday, November 06, 2015

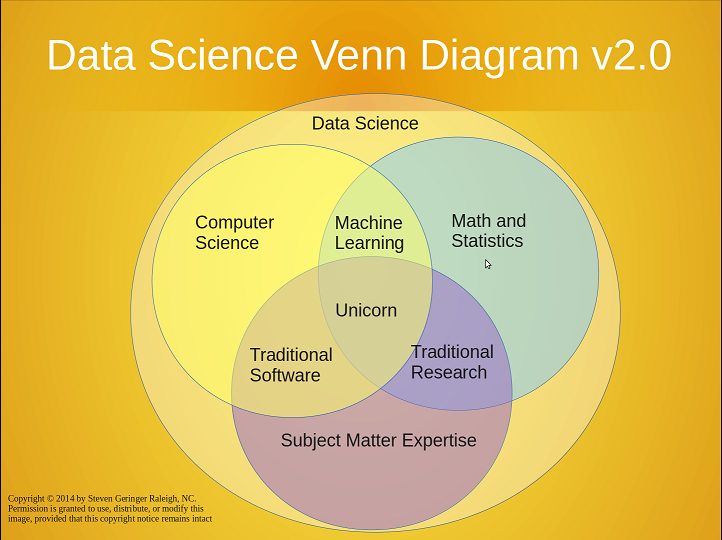
Identity crisis solved: I am a unicorn trainer

Last night, I watched the JSM encore on "the Statistics Identity Crisis". First, let me just say I was so relieved to learn that I am not the only one who felt the puzzlement "am I a data scientist or not?" I have never felt that tomatoes are so relatable.


Following the recommendation from the fourth talk, I also watched "Big Data, Data Science and Statistics. Can we all live together?" by Terry Speed. He compared the description of data science with his research profile and said:"I guess I have been doing data science after all." Precisely what I felt. 


Data Science, Big Data and Statistics – can we all live together? from Chalmers Internal on Vimeo.


These two videos touched on several important areas statisticians need to work on in order to be more involved in Data Science (if you want to be more involved, of course). In particular, we need to equip our students with problem solving skills, programming and "hacking" skills, collaboration and communication skills. These skills cannot be taught in the conventional pedagogy in Statistics. It would require more real-data projects with open-end problems and opportunity to collaborate with non-statisticians. It would require to encourage the students to be never satisfied with their models, their codes and their visualization/presentation, and strive for better models, faster  algorithms and clearer presentation. This has been a focus in every research project of mine with my PhD students. I love how Professor Lance Waller from Emory University hacked his business card to give himself a title of "unicorn trainer." My current PhD students are packing up domain knowledge and computing skills in parallel computing, data management and visualization in their individual projects, in additional to their research in statistics and machine learning. In other words, they are indeed becoming unicorns.


Next semester, I will be teaching a course on "Applied Data Science" that is data-centric and project-based. It will not be organized by methodology topics as the pre-requisites cover both statistical modeling and machine learning. Every 2-3 weeks, we will explore analytics on a type of non-traditional data. There will be a lot of discussion, brain-storming, real-time hacking, code reviews, etc. It is intended for graduate students in Statistics to gain more data science skills and overcome the fear towards the real-world messiness in real data (big or small). Hopefully, we can get some unicorns-to-be out of this course as well. 


Incidentally, I ran into ASA's statement of the role of Statistics in Data Science today. My favorite quote from this statement is:
For statisticians to help meet the considerable challenges faced by data scientists requires a sustained and substantial collaborative effort with researchers with expertise in data organization and in the flow and distribution of computation. Statisticians must engage them, learn from them, teach them, and work with them.

Sunday, November 01, 2015

Several pointers for graduate students in 140 characters

I gave a casual "speech" in a recent casual pizza hour for our MA students. It was intended to be a chat but the students didn't ask many questions and I just went on and on. So it felt like a speech. One of the students tweeted:


I couldn't have summarized better.

Wednesday, October 28, 2015

Prediction-oriented learning

Our paper on "Why significant variables aren’t automatically good predictors" just came out on PNAS. Here is the press release.

This paper was motivated by our long-time observation of variables selected using significance tests often (not always) perform poorly in prediction. This is not news to many applied scientists we spoke to but the reason for this phenomenon has not been explicitly discussed. Incidentally, also observed in our own research, variables selected using our own I score seem to do better.

Through the course of writing this paper, we came to realize how significance and predictivity are fundamentally different. For example, for a set of variables, its innate predictivity (or power to discern between two classes) does not depend on observed data while significance is a notion applied to sample statistics. As sample sizes grow, most sample statistics relevant to the population quantities that decide predictivity will eventually correlate well with predicitivity. However with finite samples, significant sets and predictive sets do not entirely overlap.

In our project, we tried various simulations to illustrate and understand this disparity, some of which are too complicated to be included in our intend-to-be-accessible paper. For example, using a designed scenario, we manage to recreate the Venn diagram above using simulations. 


Using observed data while evaluating variables for prediction, we inevitably have to rely on certain "sample statistics". We have found in our research presented in our paper, certain prediction-oriented statistics would correlate better with the level of predictivity and test statistics may not. This is because test statistics are often designed to have power to detect ANY departure from the null hypothesis but only certain departures will lead to substantial improvement in predictive performance. 


Friday, October 09, 2015

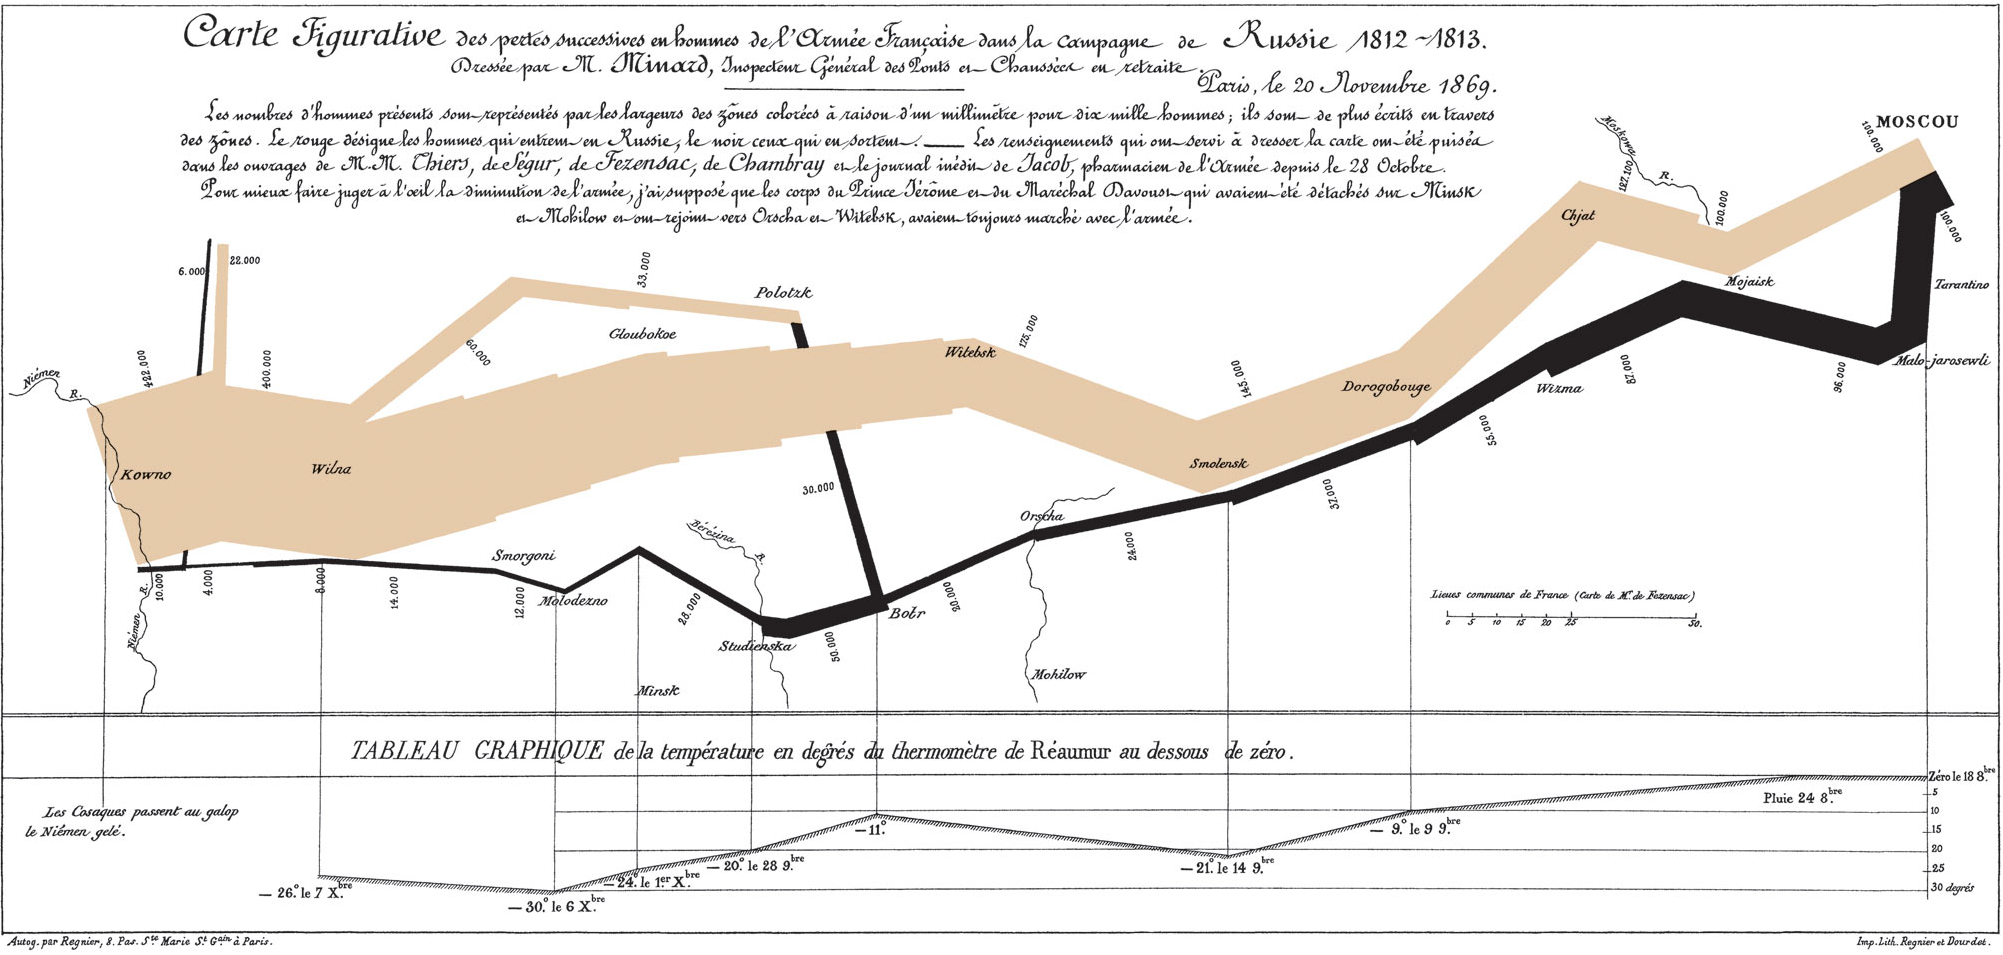
Re-vision Minard's plot

Minard's plot is a famous example in the history of visualization. Using thickness of lines, it clearly documented Napoleon's fateful defeat in 1812.
Many have attempted to recreate this graph using modern tools. Here is mine using my favorite and only data science programming tool, R. It can still be improved as when the line turns sharply, the thickness are off. I got lazy with algebra.