Twitter

Monday, November 01, 2021

The Collaboratory Program at Columbia


A summary of my @TheHDSR paper with @IsabelleZaugg, Trish Culligan and Richard Witten on the Collaboratory Program @Columbia, a collaboration of @ColumbiaEship and @DataSciColumbia.

https://hdsr.mitpress.mit.edu/pub/j8v2h5hc/release/2 

Columbia's Collaboratory program is to "Preparing Tomorrow’s Leaders for a Data-Rich World". It offers a meta-model for a data science education accelerator program that allows HE institutions to respond to their own disciplinary heterogeneity. (entrepreneurship.columbia.edu/collaboratory/)

One way to think about it is that the Collaboratory crowd-sources innovative new course designs by providing seed funding to support transdisciplinary collaboration between data scientists and domain experts, called “Collaboratory Fellows.”

The Collaboratory jumpstarts data-driven pedagogy that otherwise would take years to develop. Here is a video where a few Collaboratory program's leaders and fellows discuss the impacts of the program.

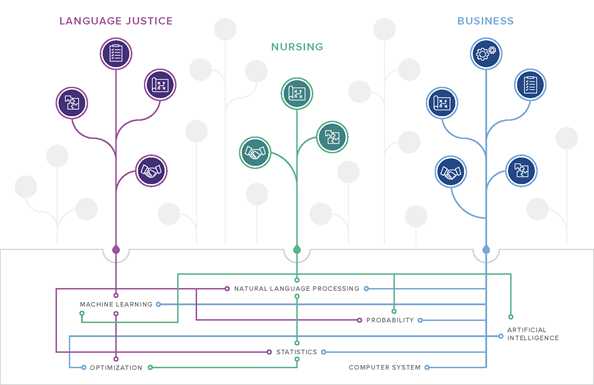
Collaboratory Program in numbers
Over the past 5 yrs,
67 Collaboratory Fellows
21 Collaboratory projects
Span 14 schools
14 institutes and centers,
26 departments
36 new courses
served the learning needs
of more than 4,000 students.

In this @TheHDSR article, we outlined different levels of data science competency and the Collaboratory's curriculum development life cycle. More importantly, we reflected on value creation through the Collaboratory and challenges that remain. The Collaboratory can be thought of as an aspen grove that stems from a unifying idea and funding source and shares the Collaboratory Fellows cohort structure of mutual support and collective resources. It consistently drives the creation of new courses that serve students throughout the many domains of the university, just like an aspen grove sending out new shoots that grow into trees, quickly covering large landmasses with a beautiful canopy.

Wednesday, July 11, 2018

Forget P-values? or just let it be what it is

P-value has always been controversial. It is required for certain publications, banned from some journals, hated by many, yet quoted widely. Not all p-values are loved equally. Because of a "rule" popularized some 90 years ago, small values below 0.05 have been the crowd's favorite.

When teaching hypothesis testing, we explain that the entire spectrum of p-value serves a single purpose: quantifying the "agreement" between an observed set of data and a statement (or claim) known as the null hypothesis.

Why are we "obsessed" with the small values then? Why can't we talk about any specific p-value the same way we talk about today's temperature? i.e., as a measure of something.

First of all, the scale of the p-value is hard to talk about. This is different from temperature. The difference between 0.21 and 0.20 is not the same as 0.02 and 0.01.

It almost feels like we should use the reciprocal of a p-value to discuss the likeliness of the corresponding observed "data" (represented by a summary/test statistic), assuming the null hypothesis is true.
If the null hypothesis is true, it takes, on average, 100 independent tests to observe a p-value below 0.01. The occurrence of a p-value under 0.02 is twice as likely, taking only about 50 tests to observe. Therefore 0.01 is twice as unlikely as 0.02. Using a similar calculation, 0.21 and 0.20 are almost identical in terms of likeliness under the null.
In Introductory Statistics, we teach that a test of significance has four steps:
  1. stating the hypotheses and a desired level of significance;
  2. computing the test statistics;
  3. finding the p-value;
  4. concluding given the p-value. 
It is step 4 that requires us to draw a line somewhere on the spectrum of p-value between 0 and 1. That line is known as the level of significance.

I never enjoyed explaining how one would choose a level of significance. Many of my students felt confused. Technically speaking, if a student derived a p-value of 0.28, she can claim it is significant at a significance level of 0.30. The reason why this is silly is that a chosen significance level should convey a certain sense of rare occurrence: so rare that it is deemed contradictory with the null hypothesis. No one of common sense would argue a chance that is close to 1 out of 3 represents rarity.

What common sense fails to deliver is how rare is contradictory enough. A recent HBR article showed that people have a wide variation in how they perceive a concept of likelihood such as "rare".

The solution?
"Use probabilities instead of words to avoid misinterpretation." 
P-value and significance level serve precisely this purpose.

Why 1/20 needs to be a universal choice? It doesn't. Statisticians are not quite bothered by "insignificant results" as we think 0.051 is just as interesting as 0.049. We, whenever possible, always just report the actual p-value instead of stating that we reject/accept the null hypothesis at a certain level. We use p-value to quantify the strength of evidence between variables and studies.

However, sometimes we don't have a choice so we got creative.

For any particular test between a null hypothesis and an alternative, a representative (i.e., not with selection bias) sample of p-values will offer a much better picture than the current published record of a handful of p-values under 0.05 out of who-knows-how-many trials. There have been suggestions on publishing insignificant results to avoid the so-called "cherry-picking" based on p-values. Despite the apparent appeal of such a reform, I cannot imagine it is practically possible. First of all, if we can assume that most people have been following the 0.05 "rule", publishing all the insignificant results will result in a 20-fold increase in the number of published studies. Yet it probably will create a very interesting data set for data mining. What would be useful is to have a public database of p-values on repeated studies of the precisely same test (not just the null hypothesis, as the test depends on what is the alternative as well). In such a database, p-value can finally be just what it is, a measure of agreement between a data set and a claim.

Thursday, June 21, 2018

DSI Scholars Initiation Boot Camp - Project-based learning of the Data Science life cycle

"How do you give a Data Science bootcamp to a mixed cohort of undergraduate and graduate students from a wide range of disciplines?" This is a question I was facing earlier this year when I needed to design the initiation boot camp for our inaugural class of DSI Scholars.  Some of them are rising sophomores, and some of them are PhDs in English. Some of these students had years of coding experience, some of these students had taken a full curriculum in Statistics and Machine Learning, and some of them thought "we probably won't fit in a data science boot camp at all."

The DSI Scholars program is to promote data science research and create a learning community for student researchers, especially during the slow months of summer. The learning goals of the boot camp were designed to be less about specific ML tools or programming languages. Rather it was set out to be about the data science lifecycle, statistical thinking, data quality, reproducibility, interpretability of ML methods, data ethics ...


Therefore ...

In 5 days, student teams carried out the tasks of 

  • mapping research question - understand the domain question, identify data for answering the question and interpret the domain question to a data question;
  • applying DS tools - for the data question, carry out exploratory data analysis, create data visualization and choose appropriate models and machine learning algorithms;
  • interpreting and discussing results - what do the data results suggest in the light of the original research questions. 
Here is the approximate schedule of our bootcamp.

Day 1: studied the news coverage on @ProPublica story, discussed "what is fairness?" (taking notes from @mrtz's fairmlclass.github.io), played the Ultimatum Game, watched how monkey perceives fairness and failed to balance 2 definitions of fairness. 


Day 2a: teams studied @ProPublica's detailed account of their analysis (propublica.org/article/how-we…). Each team presented a part of the report. One team studied in detail how "recidivism" is defined in the study and commented "whether we should even be predicting recidivism." 


Day2b-Day3a: teams were then tasked to reproduce the analysis using data and codes shared (github.com/propublica/com…) and asked to explore the data more. 

Day 3b: we studied research on interpretable ML for recidivism prediction (arxiv.org/abs/1503.07810). We focused on how new ML tools were developed, evaluated and compared with conventional approaches; and how the evidence supporting new research presented and communicated.

Day 4-5: the teams worked on one idea they'd like to try with the data and presented their final projects. We didn't find a solution but we asked many good questions. Read more about our bootcamp at datascience.columbia.edu/scholars/bootc…

Tuesday, October 10, 2017

Statistical thoughts on learning from Google search trends

Today I was invited to gave comments at the book signing presentation by Seth Stephens-Davidowitz on his book: "Everybody Lies: Big Data, New Data, and What the Internet Can Tell Us About Who We Really Are". Here are my comments, which were random statistical thoughts I had while reading this book.
    • "many economists to pay more attention to human behavior”
    • “people are not rational”
    • Reminded me of the most interesting aspect of this book: behind every google search, there is a human decision. 
  • Google search expanded our knowledge. 
    • There are two types of knowledge: the facts that you know and the facts that you know how to find them when needed. 
    • Google increased the amount of the second type of knowledge by multiple magnitude. 
    • In 2012, it is estimated that there are 3.3 billions Google searches per day, 47K a second.
    • Now: 63K from Live Internet Stats.
  • Google ranking algorithm: 
    • How does it change how we acquire knowledge and evaluate evidence? 
    • Has it been using personalization based on your location and prior search pattern? 
    • In what ways does a Google search differ from people asking friends for opinions or suggestions?
    • Google consumer confidence report 2017
      • Trust in Google remains high as 72.3% of respondents trust the accuracy of Google search results.
      • 63.7% of respondents don’t know how Google make money from search.
      • 65.3% said they would not want more relevant Google search results if it meant Google would use their search history to generate their results – something which Google is doing anyway.
  • Google Flu Trends story
    • In 2008, researchers from Google experimented predicting trends of seasonal flu based on people’s searches. 
    • They published a paper in Nature, explaining an intuitive idea that people who are coming down with the flu would search for flu-related information on Google, providing almost instant signals of overall flu prevalence. 
    • The research behind this paper was based on machine learning algorithms constructed using search data fitted against real-world flu tracking information from the Centers for Disease Control and Prevention. 
    • In 2013, Google flu trends missing at the peak of the 2013 flu season by 140 percent. 
    • In a 2014 Science paper, researchers found that 
    • Google’s GFT algorithm simply overfitted. 
    • It is sensitive to seasonal terms unrelated to the flu, like “high school basketball.” 
    • Google’s GFT algorithm also did not consider changes in search behavior over time, including influences from their own new search features.
    • It was suggested that GFT should be updated in collaboration with CDC. 
    • This is an example that there is information in “big data” but using such information to derive correct knowledge and insights require careful modeling and interdisciplinary collaboration. 
  • Natural language is hard
  • Actually science is hard.
  • Google search reveal secrets
    • Related to research conducted by my collaborator Sarah Cowan.
  • Pay attention to data collected and not collected: https://www.squawkpoint.com/2015/01/sample-bias/

Monday, September 25, 2017

Aggregated relation data (ARD), what is that?

Today, an academic friend of mine asked me about a series of papers I wrote on the topic of "how many X's do you know" questions. These papers are about a special kind of indirect "network" data that do not have detailed information on individual edges in a network. Rather, it contains counts of the edges that connects an ego towards a number of specific subpopulations.

Relational data, such as records of citations, online communication and social contacts, contain interesting information regarding the mechanisms that drive the dynamics of such interactions under different contexts. Current technology allows detailed observation and recording of these interaction, creating both opportunities and challenges. Aggregated relation data (ARD) are local summaries of these interactions, via aggregation. This has become a useful and common means of learning about hidden, hard-to-count and relatively small populations in the social network, also known as the network scale-up method.

Our papers since 2006 started with proposing better statistical models for such data. We further discussed data collection insights we came to realize during our research. We showed that via innovative statistical modeling, ARD can be used to estimate personal network sizes, the sizes and demographic profiles of hidden populations, and non-random mixing structures of the general social network. In particular, in our 2015 paper, we proposed  a model for ARD that is close to the latent space model by Hoff et al (2002) for full-network data. This would allow us to connect and possibly combine information from ARD with partially observed full network data.